
Menu


18,996 stat sheets later, the verdict is officially in... Everything you think you know about optimal roster value is wrong.
If you've ever had to defend your team choice at a real-life tailgate or argue why active roster management beats leaving your lineup on cruise control, we just handed you the ultimate, data-backed cheat sheet.
Here is the definitive, macro-level look at how the 2025 season actually shook out under the Tailgate lens.

Before we dive into the weeds, let's look at the high-level dashboard from a historic year on the gridiron:
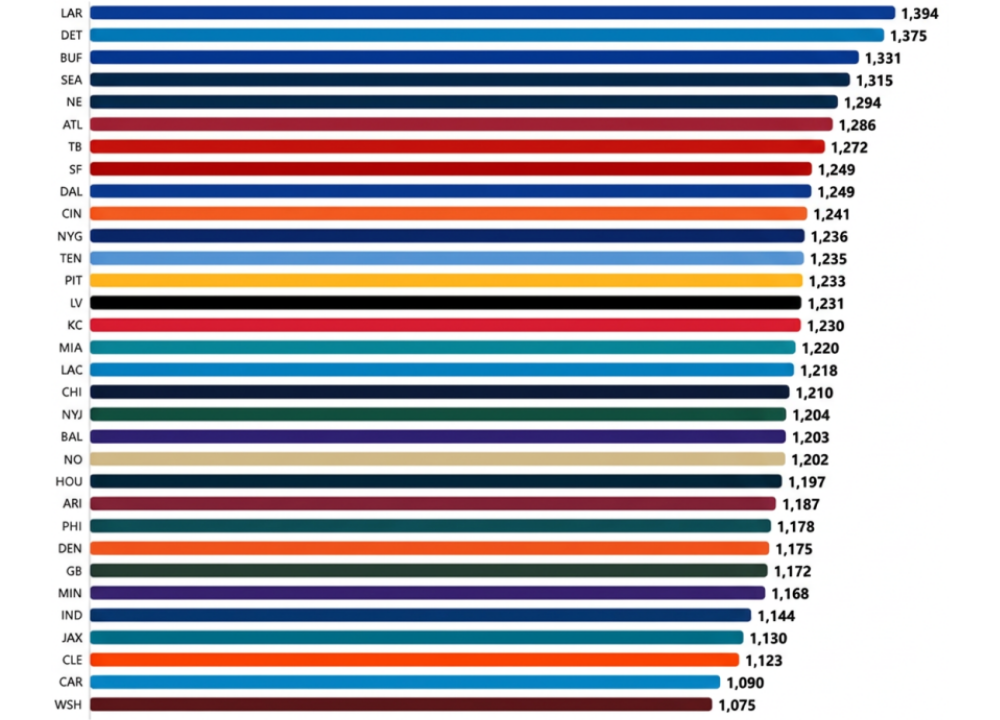
Best Team Pick: LAR (Los Angeles Rams) - 1,394.3 optimal trio points.
Season MVP: Christian McCaffrey (427.1 total points, exactly 0 bust weeks).
Weekly Management Edge: +46% median gain from choosing your optimal trio weekly versus just holding your best three players all year.
Competitive Balance: 1.30x spread between the single best and worst optimal team totals, with 12 different NFL franchises winning at least one individual week.
The core mechanic of Tailgate is beautifully simple: pick your squad and optimize your 3-man lineup weekly. But if you blindly hitched your wagon to the wrong franchise back in Week 1, how much ceiling did you leave on the table?
When looking at the total season value of each team's weekly optimal trio, which is the absolute best possible 3-player score a team offered each week, Los Angeles and Detroit are in a league of their own.
On the flip side, resetting your team identity was a survival requirement if you started with the Washington Commanders (1,075.4 optimal pts) or the Carolina Panthers (1,089.5 optimal pts), who anchored the bottom of the league's volatility graph.
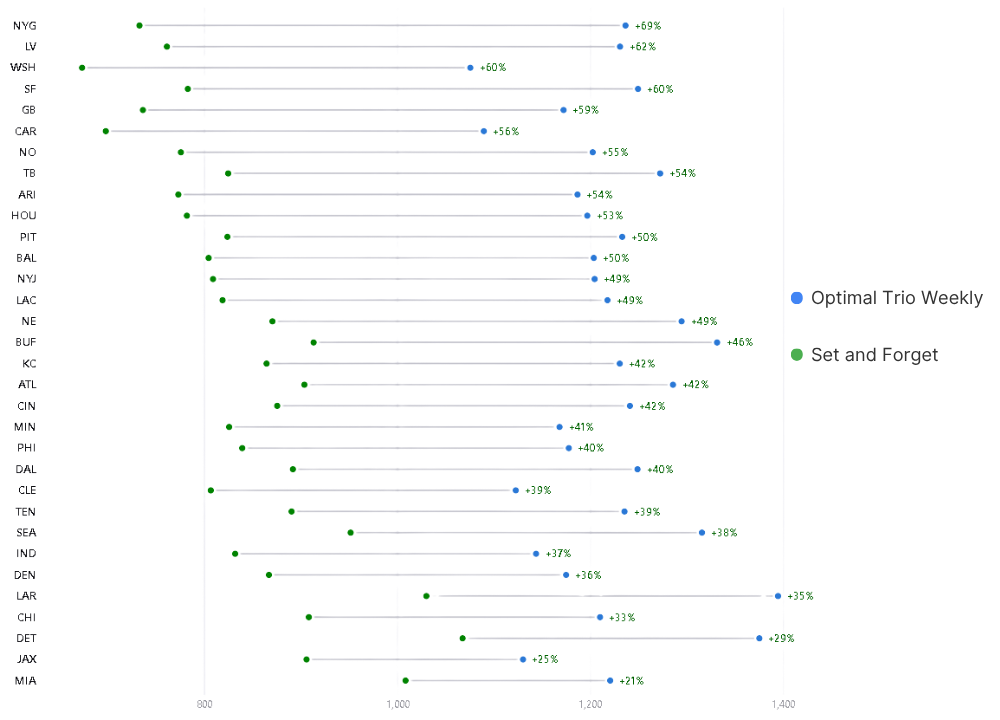
Good news for league engagement: showing up matters. We compared the data of a manager who "set-and-forget" a team's top three highest-scoring players for the entire year against an active manager selecting the optimal trio week-by-week.
The results?
Even the absolute lowest management edge in the league (Miami) netted an active player a +21% point increase.
If you managed a more volatile roster, your active management edge exploded into game-winning territory:
New York Giants (NYG): +68.7% Edge (1,236.2 optimal vs. 732.6 hold). If you held Tremaine Edmunds, Jaxson Dart, and Brian Burns all year, you left a massive +503.6 points out on the field.
Las Vegas Raiders (LV): +61.7% Edge (1,230.6 optimal vs. 761.0 hold).
Washington Commanders (WSH): +59.8% Edge (1,075.4 optimal vs. 673.1 hold).
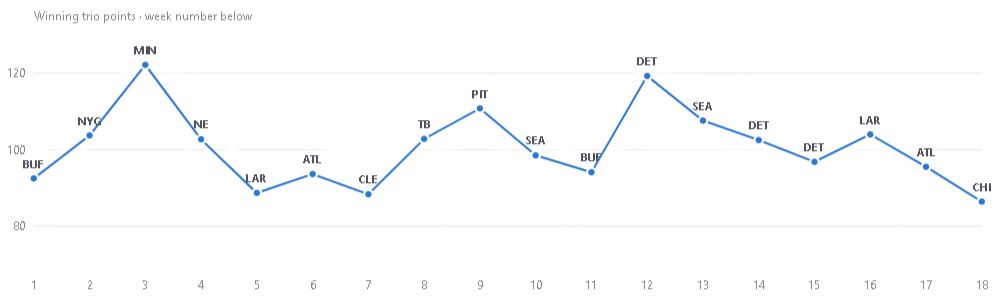
The winning trio score each week, labeled by team. Twelve different teams won at least one of the eighteen weeks. Team choice matters, but no one ran the table.
If you're still drafting your lineups like it’s a traditional offensive-only league, you're actively playing with a blindfold on.
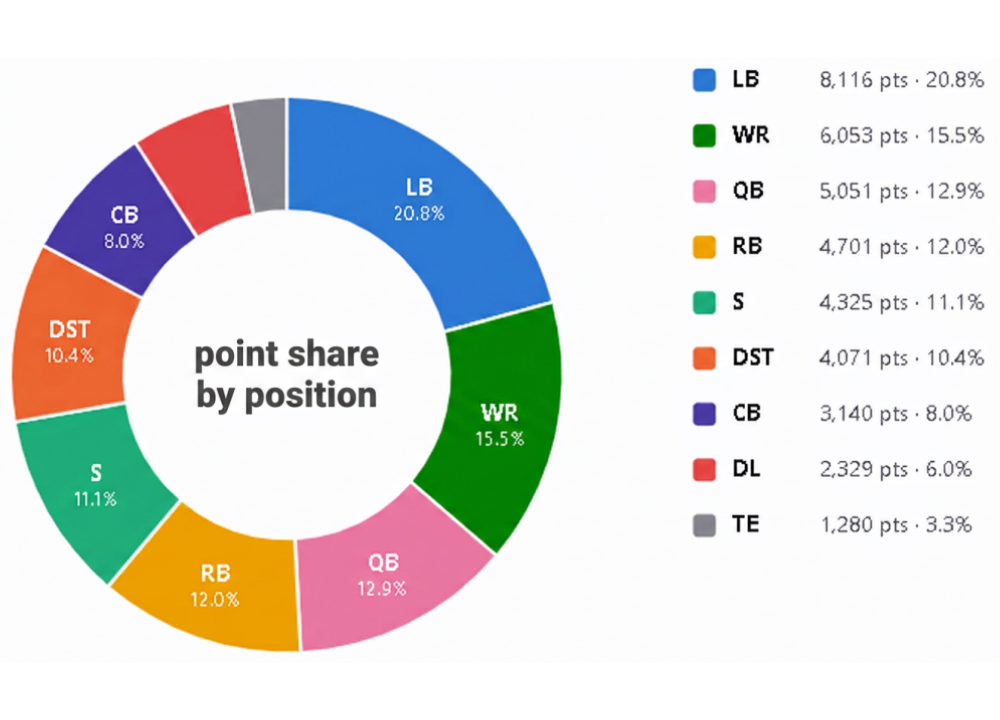
Thanks to our Individual Defensive Player (IDP) rulesets, Linebackers (LBs) are the single most valuable asset class in the entire Tailgate ecosystem.
Here is how optimal-trio points break down by position across the entire league:
🛡️ LB: 20.8% of all points
🏃🏾♂️➡️ WR: 15.5% of all points
🏈 QB: 12.9% of all points
👟 RB: 12.0% of all points
✈️ S: 11.1% of all points
🛑 DST: 10.4% of all points
🔒 CB: 8.0% of all points
💥 DL: 6.0% of all points
👐 TE: 3.3% of all points
Note: Kickers exactly accounted for 0.0% of all optimal trios. Leave them at the stadium gates if you’re shooting for upside.
While defensive anchors dominate the total volume of points, elite offensive superstars still own the absolute ceiling of the game.
These five players individualistically altered the landscape of the 2025 season:
1. Christian McCaffrey (RB · SF): 427.1 Total Points | 25.1 Avg | 12 Boom Weeks (20+ points), 0 Busts. The undisputed king of stability.
2. Jordyn Brooks (LB · MIA): 384.0 Total Points | 22.6 Avg | 10 Boom Weeks, 0 Busts. The premier defensive anchor in the game.
3. Puka Nacua (WR · LAR): 375.0 Total Points | 23.4 Avg | 10 Boom Weeks, 1 Bust. The engine behind the Rams' #1 overall team rank.
4. Jahmyr Gibbs (RB · DET): 370.9 Total Points | 21.8 Avg | 7 Boom Weeks, 0 Busts.
5. Bijan Robinson (RB · ATL): 370.8 Total Points | 21.8 Avg | 9 Boom Weeks, 0 Busts.
Next, let’s look at the players who absolutely caught fire on a single Sunday, and the steady forces who refused to turn in a bad game tape.
Best Single Weeks:
Jahmyr Gibbs (RB · DET · Wk 12): 55.4 points (The single highest score of the season).
Jonathan Taylor (RB · IND · Wk 10): 52.1 points.
Ernest Jones IV (LB · SEA · Wk 13): 49.6 points.
Longest 15+ Point Streaks:
Jack Campbell (LB · DET): 15 games (Weeks 1–16) — Complete and total defensive predictability.
De'Von Achane (RB · MIA): 15 games (Weeks 1–16).
Drake Maye (QB · NE): 12 games (Weeks 6–18).
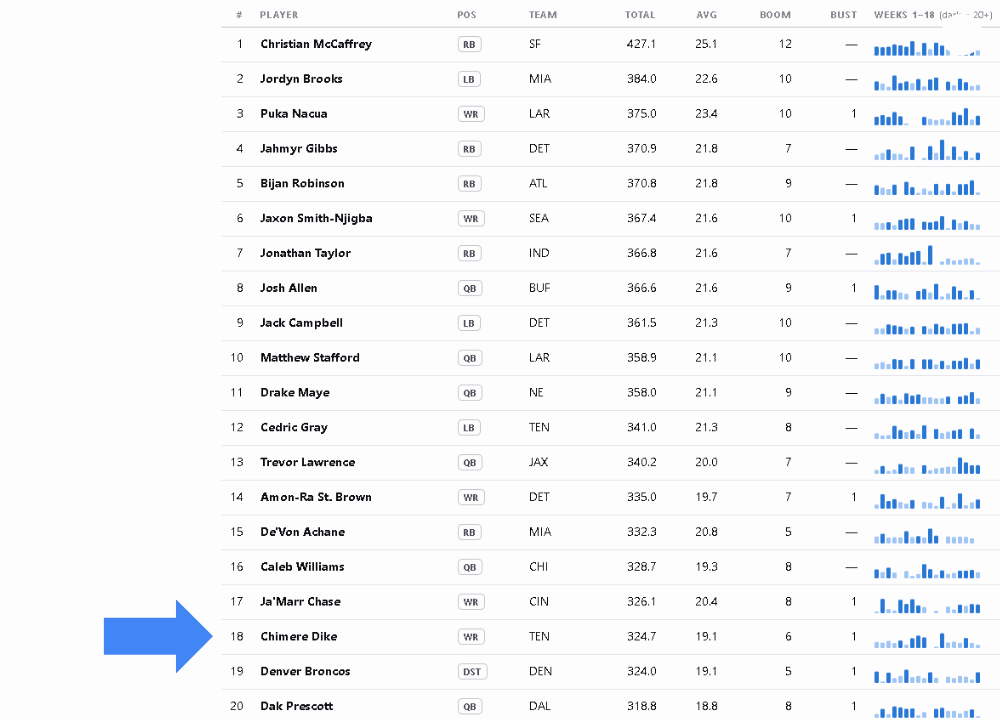
Below are your top 20 players based off season totals with weekly shape. Boom = 20+ point week, bust = under 5 points.
You'll notice here that 🎵 one of these things is not like the others, one of these things is different 🎵
If you guessed Chimere Dike then you are correct!
Who would've thought that a wideout from the *checks notes* Tennessee Titans would have been able to crack the top 20!?
Now you may be wondering why that doesn't add up with your numbers from other, traditional fantasy football platforms, and that's because with Tailgate, players earn return yards of 0.1 points per yard.
Dike had 1986 punt+kickoff yards over all 17 games for an average return yard score of 11.68 pts. Sprinkle in some receiving here and there and he's way up there. He was the #2 kickoff returner in the league and the #1 punt returner.
The #1 kickoff returner, KaVontae Turpin from Dallas, is 53 on our board, but he missed 2 games or probably would've been higher with his averages too.
You may not normally like return yards, but this is by design to increase scoring parity and help keep the bottom feeder teams competitive with the big dogs.
If a bad team like the Titans is getting scored on often, they are also receiving a bunch of kickoffs, leading to more opportunities to rack up stats. This makes more guys playable than usual, especially quality special teamers who also get time on offense.
Thinking we should close out this post with some cold, hard, data-driven hot takes that you actually care about based on the numbers:
Your favorite quarterback is a backup asset class. QBs are normally kings of scoring overall with traditional fantasy football. Under Tailgate scoring, they are an afterthought. Look at the positional breakdown: Linebackers accounted for 20.8% of all optimal points, while Quarterbacks choked up a measly 12.9%. You are literally better off identifying a high-tackle defensive mastermind than agonizing over a passing matchup.
The Giants and Raiders are elite fantasy factories (Seriously). If you picked the New York Giants or Las Vegas Raiders in Week 1, your friends probably laughed at you. But if you actually managed them weekly, you had the ultimate laugh. The Giants yielded a staggering +68.7% active management edge over a dead lineup (1,236.2 optimal vs. 732.6 hold), and the Raiders gave you a +61.7% edge. Volatility isn’t a curse; it’s a goldmine for managers who actually pay attention.
The Mahomes Tax is a scam. Patrick Mahomes didn't even crack the top 10 individual season totals, and the Kansas City Chiefs offense finished a mediocre 15th overall in team ceiling (1,230.3 pts). Meanwhile, the Drake Maye-led New England Patriots secretly finished 5th overall (1,294.4 pts). Let your league mates pick teams and set lineups based on jersey sales while you build an actual powerhouse.
The data has spoken.
Fandom-based fantasy football rewards the active strategist.
If you map your weekly rotation around premium linebacker points and the best players, not just the most popular names, and actively manage your trio instead of setting-and-forgetting, the leaderboard is yours for the taking!
Study this data, find your team’s edges, and get ready to deploy these insights when the new season kicks off.
See you at the Tailgate 🍻
- The TFS Team